During the 2024-2025 admissions cycle, Tufts University had an acceptance rate of 11.5% – not their lowest ever, but still extremely selective. But that acceptance rate by itself doesn’t explain very much. How is that number actually produced? What does Tufts care about in an applicant? Tufts does release some admissions data, but interpreting it meaningfully requires stepping back and examining the details more carefully. That’s exactly why we analyze these numbers each year, to help students and families approach selective admissions with a clearer understanding of the landscape and a thoughtful strategy.
To start, we rely on the Common Data Set, usually abbreviated as the CDS. Most colleges and universities in the United States complete this standardized report so that organizations like U.S. News & World Report, College Board, and Peterson’s can present comparable institutional data. The CDS includes a wide range of information about each university, but the section that matters most for applicants is Section C, which focuses on first-time, first-year admissions. For this analysis, we’re looking specifically at Tufts’ 2024–2025 CDS.
Trend Spotting: Five Years of Tufts Admissions
Before focusing only on the most recent cycle, it helps to zoom out and look at the broader trajectory of Tufts admissions. In the years surrounding the pandemic, many highly selective universities experienced major fluctuations in application volume. At Tufts, however, the past several admissions cycles have looked relatively steady. Application numbers remain high, while the size of the incoming class has changed very little, leaving overall selectivity consistently tight.
| Year | Total Applicants | Number of Admitted Students | Overall Acceptance Rate* |
|---|---|---|---|
| 2025 | 34,432 | 3,957 | 11.50% |
| 2024 | 34,003 | 3,444 | 10.10% |
| 2023 | 34,881 | 3,381 | 9.70% |
| 2022 | 31,198 | 3,566 | 11.40% |
| 2021 | 23,127 | 3,770 | 16.30% |
*Denotes our own calculation based on the raw numbers
Why This Matters: Because Tufts’ admissions patterns have been relatively steady, applicants can approach the next few cycles with a clearer sense of the landscape
When you apply to Tufts, you’re entering a pool filled with applicants who already look extremely strong academically. Tufts has long attracted students with interdisciplinary interests and high community engagement, so simply having impressive credentials isn’t enough. Applicants who stand out tend to present a resume that feels thoughtful and cohesive rather than scattered or stuffed.
C1: First-Time, First-Year Admission, Applications
To understand what this applicant pool actually looks like, it helps to start with the numbers – specifically how applications break down across the class. Their Common Data Set provides a closer look at the composition of applicants, including differences by gender and location.
| First-time, First-year Applicants | Applied | Admitted | Acceptance Rate | Enrolled | Yield Rate |
|---|---|---|---|---|---|
| Men | 14,310 | 1,633 | 11.40% | 733 | 44.90% |
| Women | 18,834 | 2,189 | 11.60% | 1,000 | 45.70% |
| Another Gender | 735 | 93 | 13% | 47 | 50.50% |
| Unknown Gender | 553 | 42 | 7.60% | 21 | 50.00% |
| Total | 34,432 | 3,957 | 11.50% | 1,801 | 45.50% |
*Denotes our own calculation based on the raw numbers
| First-time, first-year applicants | Total | In-state | Out-of-state | International | Unknown |
|---|---|---|---|---|---|
| Applied | 34,432 | 4,684 | 20,401 | 9,336 | 11 |
| Percent of total applicant pool | 100% | 13.60% | 59.30% | 27.10% | 0.03% |
| Admitted | 3,957 | 701 | 2,672 | 584 | 0 |
| Acceptance Rate | 11.50% | 14.90% | 13.10% | 6.30% | 0.00% |
| Enrolled | 1,801 | 368 | 1,134 | 299 | 0 |
| Yield Rate* | 45.50% | 52.50% | 42.40% | 51.20% | 0% |
*Denotes our own calculation based on the raw numbers
Key Takeaways for Acceptance Rates:
Yield is lower than many people expect, largely because admitted students often have multiple highly competitive options
More women apply to Tufts than men, and women also make up a slightly larger share of admitted and enrolled students
Tufts reports a meaningful number of students identifying outside the traditional gender binary, which is consistent with the school’s personality and culture
Tufts is unquestionably competitive, but understanding the admissions process requires looking beyond reputation or vibes alone. Data offers a clearer framework for evaluating the odds and identifying realistic benchmarks. Without that context, it’s easy to rely on assumptions rather than evidence when assessing how selective the process really is.
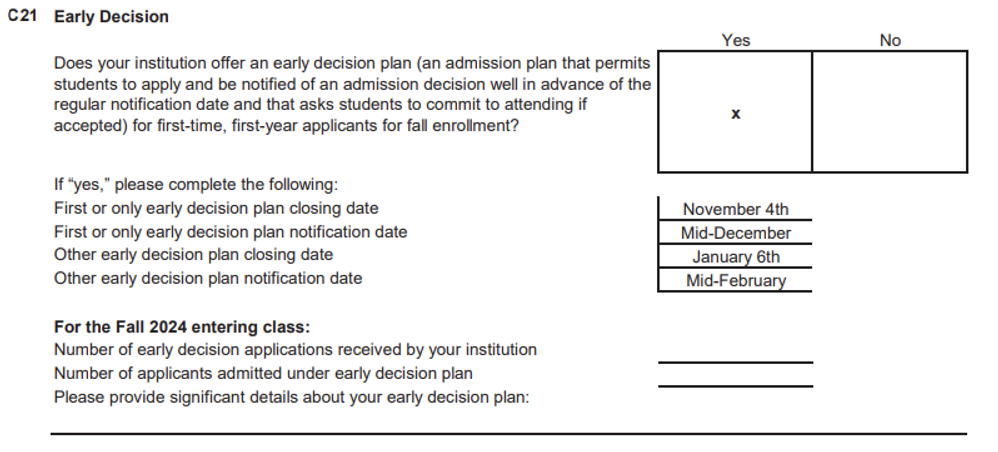
Early Decision
Students applying to Tufts through Early Decision have historically seen higher admission rates than those applying in the Regular Decision pool. We know this because we work with ED and ED2 applicants to Tufts every single year. Unfortunately for us, and for you, the reader, Tufts does not give us the raw data on ED.
We imagine this is because they don’t want to show their cards, which is silly. That’s the point of the CDS. Pro tip for Tufts: if you want a higher yield rate, maybe take more of your incoming class from ED and ED2!
Waitlist
A lot of universities release very little information about their waitlists, but Tufts gives us the data! Thank you, Tufts! The data is pretty surprising, but we’re not mad at it.
| Students placed on waitlist | 2,800 |
|---|---|
| Percent of Total Applicants Waitlisted | 8.10% |
| Students accepting a spot on the waitlist | 991 |
| Percent of students accepting a waitlist spot | 35.40% |
| Students admitted off the waitlist | 354 |
| Waitlist acceptance rate | 35.70% |
| Percent of total accepted students who were admitted from the waitlist | 17% |
*Denotes our own calculation based on the raw numbers
Why This Matters: Tufts doesn’t waitlist that many students, and they accept a much larger portion than similar schools. Almost 20% of their incoming class is from the waitlist, which is one of the highest we’ve seen.
When students receive a waitlist decision, some interpret it as a rejection in softer language, while others treat it as a near-acceptance. Neither is true. A waitlist decision signals that Tufts believes you could thrive on campus – they simply don’t have space in the class at that moment. Movement depends entirely on how the admitted class shapes up after students make their enrollment decisions, which means it varies from year to year and is usually limited. Still, it does happen. Each year we work with students navigating Tufts waitlists and help them take the right steps to remain competitive if spots open later in the cycle.
C9-C2: First-Time, First-Year Profile, or Scores and Grades
Tufts currently operates with a test-optional policy, but that shouldn’t be mistaken for a signal that standardized testing isn’t important to them. Across higher ed, colleges are increasingly studying how different groups of admitted students perform once they arrive on campus. Some schools have concluded that applicants admitted without scores face more academic difficulty, which is part of why testing requirements have begun returning in certain places. Tufts has chosen to remain test-optional for now, and we’d wager to guess that they’ll remain test-optional for the foreseeable future, but strong scores still add meaningful context to an application.
Even though Tufts is test-optional, the available numbers are revealing. Looking at how many enrolled students submitted scores and how competitive those scores were offers insight into Tufts’ academic expectations.
Breakdown of enrolled students who submitted test scores:
| Percent | Number | |
|---|---|---|
| Submitting SAT Scores | 38% | 687 |
| Submitting ACT Scores | 18% | 318 |
| Total Submitting Scores* | 56% | 1,005 |
*Denotes our own calculation based on the raw numbers
Why This Matters: A majority of enrolled students still chose to submit standardized test results. SAT scores appear more frequently than ACT scores in the data, which has more to do with the popularity of those tests than with whether Tufts cares more about the SAT than the ACT.
Now let’s examine the score ranges for the ACT and SAT sections.
| Test | 25th Percentile | 50th Percentile | 75th Percentile |
|---|---|---|---|
| SAT Composite | 1480 | 1510 | 1540 |
| SAT Evidence-Based Reading + Writing | 720 | 740 | 770 |
| SAT Math | 750 | 770 | 790 |
| ACT Composite | 33 | 34 | 35 |
Why This Matters: The middle-50% score ranges sit extremely high on both exams, meaning applicants generally need top-tier results to stand out academically. We recommend aiming for 1550+ and 35+ to be truly competitive.
First-time, first-year students with scores in each range:
| Score Range | SAT Evidence-Based Reading + Writing | SAT Math |
|---|---|---|
| 700-800 | 92% | 96.36% |
| 600-699 | 8% | 3.64% |
| Score Range | SAT Composite |
|---|---|
| 1400-1600 | 98.84% |
| 1200-1399 | 1.16% |
| Score Range | ACT Composite |
|---|---|
| 30-36 | 98.74% |
| 24-29 | 1.26% |
Standardized Test Score Takeaways:
Typical Tufts enrollees have very high scores, and there’s very little variance
Because these numbers reflect students who actually enrolled, it’s likely that some admitted applicants who declined their offers had even higher scores
Submitting a score that falls well below these ranges can weaken an application
To remain competitive at Tufts, an applicant’s academic profile needs to be exceptionally strong. Even scores that place a student near the top nationally may still fall toward the lower end of Tufts’ admitted range. A similar pattern emerges when we look at class rank.
| Class Rank | Percentage |
|---|---|
| Top 10th of HS graduating class | 85.00% |
| Top Quarter of HS graduating class | 95.00% |
| Top Half of HS graduating class | 99.00% |
| Bottom Half of HS graduating class | 1.00% |
| Bottom Quarter of HS graduating class | 0.00% |
| Total submitting class rank | 25.00% |
Key Class Rank Takeaways:
The overwhelming majority of enrolled students graduate near the top of their high school class
Admission rates drop quickly as class rank moves further from the top
The 1% in the bottom half is the exception, not the rule
Let’s add some perspective. The small group of admitted students with lower scores or ranks are statistical outliers, and they do not indicate that Tufts’ academic expectations are flexible. We rarely know the full context behind those decisions. Some of those applicants may be first-generation college students, students from under-resourced schools, or individuals with exceptional life circumstances. But those cases are unusual, and applicants should not assume they will be evaluated in that same context.
TL;DR: If Tufts is your goal, you should be aiming for the strongest grades and test scores possible.
Considerations
This is the point in the Common Data Set where the analysis becomes less mechanical and more interpretive. Tufts University certainly cares about clear academic indicators, like course rigor, grades, and (when submitted) standardized test scores, but those metrics mainly establish whether a student is academically prepared. Beyond that, admissions officers consider a broader set of factors that don’t fit neatly into a formula. These more subjective elements are where thoughtful strategy begins to matter most, and it’s where most of our work lies.
| Academic Factors | Very Important | Important | Considered | Not Considered |
|---|---|---|---|---|
| Rigor of secondary school record | X | |||
| Class rank | X | |||
| Academic GPA | X | |||
| Standardized test scores | X | |||
| Application Essay | X | |||
| Recommendation(s) | X |
Key Takeaways for Academic Factors:
Tufts expects applicants to get the best grades possible with the most rigorous coursework available
If you choose to submit standardized test scores, they will reinforce the strength of your academic profile
Having strong essays and recommendations can really help you at Tufts
| Nonacademic Factors | Very Important | Important | Considered | Not Considered |
|---|---|---|---|---|
| Interview | X | |||
| Extracurricular activities | X | |||
| Talent/ability | X | |||
| Character/personal qualities | X | |||
| First generation | X | |||
| Alumni/ae relation | X | |||
| Geographical residence | X | |||
| State residency | X | |||
| Religious affiliation/commitment | X | |||
| Volunteer work | X | |||
| Work experience | X | |||
| Level of applicant’s interest | X |
Key Takeaways for Nonacademic Factors:
Tufts does track demonstrated interest
Legacy status may help you at Tufts, but it won’t strengthen a weak application
Your values, especially if they’re in-line with Tufts’, are very important
Some of these elements are straightforward and can’t be changed or strategized. Geographic background or first-generation status, for example, are just plain factual parts of an application. Other qualities are much harder to measure, like curiosity, creativity, empathy, and initiative, which don’t come with numerical scores. Instead, admissions readers piece together an understanding of those characteristics by looking across the entire application – essays, recommendation letters, activities, and the story you’re trying to tell. Applicants can be intentional about how they present themselves, but interpretation ultimately rests with the admissions committee. In many ways, Tufts is trying to assess fit, which means applicants should also consider whether their interests and personality genuinely align with the university’s collaborative culture.
This is also where you can see that extracurricular activities matter a lot. The strongest applicants aren’t simply stacking clubs, sports, or collecting leadership titles. Instead, they tend to invest deeply in a smaller number of pursuits that reflect genuine curiosity and commitment to their academic passions. Plus, their activities often connect with each other in meaningful ways, and reveal their intellectual direction and personal motivation. Depth, continuity, and originality tend to matter far more than quantity, and helping students develop that kind of thoughtful profile is something we work on with families every year.
Conclusion
Tufts is highly selective, but it’s not an impossible goal. After reading this, we hope you have a clearer picture of what they’re looking for and what their selectivity actually looks like beyond the headline acceptance rate.
At the same time, admissions decisions are not made by spreadsheets and computers. They’re made by people, and at a very people-centric school like Tufts, that matters. Data can highlight trends and academic benchmarks, but it cannot fully explain what Tufts values in an applicant, and it certainly can’t tell you exactly how you need to spend your high school career to game the system. When we work with applicants, whether they’re applying ED, ED2, RD, or to one of Tufts’ specialized programs, our approach is always tailored to the student. Each strategy is built around that student’s academic strengths, interests, and long-term goals. There’s no single formula for getting into Tufts, but thoughtful choices can significantly strengthen how an application is crafted and interpreted.
One way to increase your odds? Working with college consultants who are experts in the field and have a high rate of success getting students into Tufts. We help countless students gain admission to top universities every single year – reach out to us today to get started.