During the 2024–2025 admissions cycle, the University of Michigan had an acceptance rate of 15.6%, underscoring just how competitive the process has become. But a single acceptance-rate figure doesn’t tell you very much on its own. How is that percentage determined? What forces are pushing it up or down each year? Michigan does publish some admissions information, but gaining real insight requires a deeper analysis. That kind of careful, data-driven analysis is exactly what we do annually to help students approach selective admissions with clarity, realism, and a well-built strategy.
To get there, we rely on the Common Data Set (CDS). Like most colleges and universities across the U.S., Michigan completes the CDS, a standardized reporting tool used by outlets such as U.S. News & World Report and the College Board. The document covers a wide range of institutional data, but for our purposes, we’re focusing on Section C of Michigan’s 2024–2025 CDS: first-time, first-year admissions.
Trend Spotting: Five Years of Michigan Admissions
We think it’s useful to zoom out and look at Michigan’s broader admissions arc. Over the past several years, application volume has climbed dramatically, while the number of available seats has remained relatively stable.
| Year | Total Applicants | Number of Admitted Students | Overall Acceptance Rate* |
|---|---|---|---|
| 2025 | 98,310 | 15,373 | 15.60% |
| 2024 | 87,632 | 15,722 | 17.90% |
| 2023 | 84,289 | 14,914 | 17.70% |
| 2022 | 79,743 | 16,071 | 20.20% |
| 2021 | 65,021 | 16,974 | 26.10% |
*Denotes our own calculation based on the raw numbers
Why This Matters: Michigan’s applicant pool has increased by roughly 51% in just 5 admission cycles.
Applying to Michigan means entering a pool of nearly a hundred thousand applicants who also already look strong on paper. And as we’ll see, excellent grades and demanding coursework are the entry point, not the differentiator. What separates applicants is depth, clarity of direction, and a profile that feels intentional rather than padded.
C1: First-Time, First-Year Admission, Applications
Let’s take a look at how this year breaks down:
| First-time, First-year Applicants | Applied | Admitted | Acceptance Rate | Enrolled | Yield Rate |
|---|---|---|---|---|---|
| Men | 48,101 | 6,684 | 13.90% | 3,199 | 48.10% |
| Women | 50,209 | 8,689 | 17.30% | 4,079 | 46.90% |
| Total | 98,310 | 15,373 | 16% | 7,278 | 47.30% |
*Denotes our own calculation based on the raw numbers
Key Takeaways for Acceptance Rates:
More women apply, are admitted, and enroll than men
Michigan doesn’t release in-state vs. out-of-state vs. international data, but we can tell you out-of-state and international acceptance rates will be lower than in-state
Michigan has a lower yield rate than we’d expect, but it is a public university that students may apply to as a backup option
This breakdown also doesn’t tell us how many of these applicants were looking at Ross vs. LSA vs. other colleges
Michigan’s selectivity can surprise families who remember a very different admissions landscape decades ago. Today, it’s one of the most sought-after public universities in the country. For the vast majority of students, Michigan should be considered a reach – not a safety, and often not a true target, unless you’re in-state.
Standardized Test Scores
Michigan does not require standardized test scores. That said, across higher education, testing has reemerged as a meaningful academic signal as schools examine how students perform after enrolling. At Michigan, strong scores absolutely remain part of the evaluation when they’re submitted. if you are asking our advice, we would tell you to take the test, get a great score, and submit it.
And the numbers support that. Looking at who chooses to report scores – and how competitive those scores tend to be – gives us valuable insight into what Michigan considers strong academic preparation.
| Test | 25th Percentile | 50th Percentile | 75th Percentile |
|---|---|---|---|
| SAT Composite | 1360 | 1460 | 1530 |
| SAT ERW | 680 | 720 | 750 |
| SAT Math | 680 | 740 | 780 |
| ACT Composite | 31 | 33 | 34 |
| ACT Math | 30 | 33 | 35 |
| ACT English | 33 | 35 | 35 |
| Score Range | SAT Evidence-Based Reading + Writing | SAT Math |
|---|---|---|
| 700-800 | 67% | 70% |
| 600-699 | 26% | 21% |
| 500-599 | 6% | 8% |
| 400-499 | 1% | 1% |
| 300-399 | 0% | 0.30% |
| Score Range | SAT Composite |
|---|---|
| 1400-1600 | 70% |
| 1200-1399 | 23% |
| 1000-1199 | 6% |
| 800-999 | 1.10% |
| Score Range | ACT Composite | ACT English | ACT Math |
|---|---|---|---|
| 30-36 | 91% | 90% | 78% |
| 24-29 | 8% | 8% | 20% |
| 18-23 | 1% | 1% | 2% |
| 12-17 | 0% | 0% | 0.20% |
Standardized Test Score Takeaways:
The typical admitted and enrolled Michigan student is submitting very strong test results, often well into the top national percentiles
Michigan shows a bit more range in scores than some peer institutions, but that doesn’t mean you should submit weak scores
The tiny fraction of students reporting much lower scores represents exceptions, and we have no idea what the circumstances are for those students
Because Michigan allows score submission, testing plays a consistent but contextual role. Among enrolled students, those near the top of the academic spectrum are reinforcing just how competitive the pool really is. Understanding the data lets you plan with a purpose rather than guess.
You see a similar story when you look at grades. The average high school GPA of all first-time, first-year students who submitted GPA was a 3.9, and 92.4% of applicants submitted their GPA.
Key GPA Takeaways:
| GPA Range | Percentage |
|---|---|
| 4 | 38.80% |
| 3.75 - 3.99 | 54.00% |
| 3.5 - 3.74 | 5.70% |
| 3.25 - 3.49 | 0.90% |
| 3.0 - 3.24 | 0.40% |
Anything meaningfully below a 3.9 (the average GPA of an enrolled student) weakens an application
Students reporting GPAs under 3.75 are statistical outliers and should not be used as a benchmark
It’s also important to address the very small subset of admitted students who appear in lower score bands – like those with ACT scores in the low-to-mid 20s or unusually uneven section results. These cases are exceptions, not evidence that standards are flexible, and you absolutely should not think that you are the exception.
The reality is that we don’t know who those students are or what tipped the scales in their favor. They could be recruited athletes, first-generation applicants, students from low-income schools, or other individuals with highly unusual circumstances. Every selective institution has outliers, but they don’t reflect how decisions are made for the vast majority of applicants, and it’s highly unlikely that you fall into that category.
Early Action
Early Action plays a major role in Michigan’s admissions process, but schools that use EA aren’t required to disclose the same level of detailed data that ED schools must publish in the CDS. As a result, many of the specific numbers students want simply aren’t available:
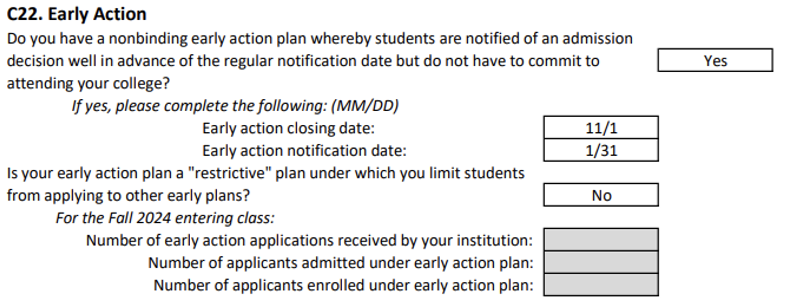
What we can say is that Michigan’s Early Action round is highly competitive and not a fallback option. Acceptance rates are generally higher than RD, but still extremely selective. For students with strong applications, especially those applying ED or REA elsewhere, EA at Michigan can make strategic sense
Waitlist
Fortunately, Michigan does publish waitlist data. Based on both the numbers and our direct experience, we can tell you that getting off the Michigan waitlist is challenging but not impossible.
| Students Placed on Waitlist | 24,804 |
|---|---|
| Percent of Total Applicants Waitlisted | 25.20% |
| Students Accepting a Spot on The Waitlist | 18,793 |
| Percent of Students Accepting Waitlist Spot | 75.80% |
| Students Admitted off The Waitlist | 973 |
| Waitlist Acceptance Rate* | 5.20% |
| Percent of total students accepted off the waitlist | 6.30% |
*Denotes our own calculation based on the raw numbers
Key Waitlist Takeaways:
Michigan offers a large number of students a place on the waitlist – 25k, almost a quarter of last year’s applicants
A significant percentage of waitlisted students (three-quarters) opt to remain on it
Despite that, actual movement off the waitlist is more limited than many families expect
When students see a waitlist decision, reactions often swing to extremes. Some interpret it as a soft rejection. Others convince themselves it’s basically a delayed acceptance, which it is not. A waitlist decision means Michigan believes you could succeed there; they just don’t currently have room. While movement is unpredictable and limited, it does happen. We help students navigate and succeed off waitlists at Michigan and other selective schools every year.
Considerations
This is the part of the Common Data Set where the numbers stop carrying the whole conversation. Yes, Michigan evaluates concrete academic indicators like GPA, course rigor, and test scores, but those are just the baseline. There are other, broader “considerations” that are inherently subjective, and this is where strategy really matters. Let’s start with academics:
| Academic Factors | Very Important | Important | Considered | Not Considered |
|---|---|---|---|---|
| Rigor of secondary school record | X | |||
| Class rank | X | |||
| Academic GPA | X | |||
| Standardized test scores | X | |||
| Application Essay | X | |||
| Recommendation(s) | X |
Key Takeaways for Academic Factors:
Academic performance carries significant weight at Michigan
Many high schools don’t report class rank, which may be why it’s not considered here
Earning top grades in the most challenging courses available to you is essential
| Nonacademic Factors | Very Important | Important | Considered | Not Considered |
|---|---|---|---|---|
| Interview | X | |||
| Extracurricular activities | X | |||
| Talent/ability | X | |||
| Character/personal qualities | X | |||
| First generation | X | |||
| Alumni/ae relation | X | |||
| Geographical residence | X | |||
| State residency | X | |||
| Religious affiliation/commitment | X | |||
| Volunteer work | X | |||
| Work experience | X | |||
| Level of applicant’s interest | X |
Key Takeaways for Nonacademic Factors:
Michigan does track demonstrated interest
First-gen students have a slight advantage
According to the CDS, legacy status does not matter, and there is no interview for Michigan
On the nonacademic side, some elements are fixed. Geographic background or first-generation status are factual parts of your file. But traits like character, personal qualities, and talent don’t come with a scoring rubric, and admissions officers synthesize these through a holistic read of your application — essays, recommendations, activities, and overall voice. You can be thoughtful about how you present yourself, but you can’t fully control interpretation.
Michigan does pay attention to demonstrated interest, and this is one of the few pieces of the process that’s actually very much in your control. Take advantage of it. Get on their mailing list and engage with what they send out. If you’re able to visit campus, do it – and if not, virtual tours and online info sessions still count. Show up when Michigan admissions hosts events in your area, and follow up with a genuine, thoughtful thank-you note afterward. If there aren’t formal events available to you, reach out to your regional admissions officer with specific, well-researched questions. Applying EA can also help contribute to demonstrated interest, too.
This is also where extracurriculars start doing real work. For applicants who are truly competitive at Michigan, especially out-of-state students or those targeting highly selective programs, surface-level involvement won’t be enough. The strongest candidates aren’t stacking clubs or padding resumes with disconnected activities. They’re deeply invested in a small number of pursuits that reflect curiosity, commitment, and intellectual direction. Their activities tell a coherent story about who they are and where they’re headed. Depth, consistency, and originality matter here, and helping students build that kind of profile is exactly what we do every year.
Conclusion
You already knew the University of Michigan is highly competitive. However, by now, you should have a much clearer sense of what that competitiveness actually looks like – beyond just an acceptance rate.
Still, admissions decisions aren’t made by spreadsheets. Data can highlight patterns and thresholds, but it can’t fully explain what Michigan values, and it certainly doesn’t define you. When we work with students – whether they’re applying Early Action, getting recruited, or trying to get into Ross, our approach is always personalized. Each strategy is built around the student’s academic strengths, interests, and long-term goals. There’s no one strategy for getting into Michigan, but there are smart choices that can strengthen how your application is evaluated. And we can help you build a profile that stands out in a very crowded field.
One way to increase your odds? Working with college consultants who are experts in the field and have a high rate of success getting students into Michigan. We help countless students gain admission to top universities every single year – reach out to us today to get started.