In the 2024–2025 application cycle, Stanford reported an admit rate of 3.61%. On its own, that figure sounds definitive – but it raises more questions than it answers. What factors actually drive it? And what information can we glean from the process by taking a deep dive into Stanford’s statistics? While schools like Stanford release select headline stats, understanding what’s happening beneath the surface requires a deeper look. Each year, we break down the data behind ultra-selective admissions so our students aren’t just guessing when they compete for spots at top colleges.
So where does this information come from? Most U.S. colleges and universities complete something called the Common Data Set, or CDS. This initiative exists to standardize admissions data for organizations like U.S. News & World Report, the College Board, and Peterson’s. The CDS itself is extensive, but for our purposes, we’re going to zoom in on a single section of Stanford’s 2024–2025 report: first-time, first-year admissions.
Trend Spotting: Five Years of Stanford Admissions
Before zeroing in on this specific cycle, it’s worth zooming out and looking at the bigger pattern taking shape at Stanford. As with other ultra-selective schools, the applicant pool mostly continues to grow while the admit rate continues to shrink.
| Year | Total Applicants | Number of Admitted Students | Acceptance Rate | Enrolled Students | Yield Rate |
|---|---|---|---|---|---|
| 2025 | 57,326 | 2,067 | 3.61% | 1,693 | 81.90% |
| 2024 | 53,733 | 2,099 | 3.90% | 1,699 | 80.90% |
| 2023 | 56,378 | 2,075 | 3.68% | 1,736 | 83.70% |
| 2022 | 55,471 | 2,190 | 3.95% | 1,757 | 80.20% |
| 2021 | 45,227 | 2,349 | 5.19% | 1,607 | 68.40% |
Why This Matters: Stanford was, and remains, competitive. Getting into Stanford will only continue to get harder each year.
Standing out in a crowd of nearly 60,000 applicants, many of whom look just as strong on paper as you do, requires positioning yourself as one of the most compelling candidates in the mix. Let’s look at the other data to help figure out how to do that.
C1: First-Time, First-Year Admission, Applications
Let’s look at the specific data breakdowns for 2024-2025 admissions:
| First-time, first-year applicants | Total | Admitted | Acceptance rate | Enrolled | Yield rate |
|---|---|---|---|---|---|
| Men | 29,602 | 1,015 | 3.43% | 835 | 82.30% |
| Women | 27,724 | 1,052 | 3.80% | 858 | 81.60% |
| First-time, first-year applicants | Total |
|---|---|
| Applied | 57,326 |
| Admitted | 2,067 |
| Acceptance rate | 3.61% |
| Enrolled | 1,693 |
| Yield rate | 81.90% |
Key Takeaways for Acceptance Rates:
More men applied to Stanford, but more women were admitted
Their acceptance rate is one of the lowest in the field
Stanford’s yield rate is amongst the highest in the highly selective category
You knew Stanford was hard to get into, obviously. It’s one of the most exclusive colleges in the world. However, the most interesting part of this data is that Stanford is not sharing international acceptance rate data. Most other colleges and universities share in-state, out-of-state, and international applicant, admit, and enrollee numbers, but Stanford has chosen to omit these. Interesting!
C9-C2: First-Time, First-Year Profile, or Scores and Grades
Stanford has returned to a test-mandatory policy for 2025-2026, aligning with a growing number of highly selective schools that have reconsidered test-optional admissions. Institutions are increasingly recognizing that students admitted without scores have, on average, struggled more academically once on campus, which isn’t ideal for the university or the students themselves. Even before the policy shift, though, Stanford’s data made their preferences pretty clear when you look closely at who was submitting scores.
| Percent | Number | |
|---|---|---|
| Submitting SAT Scores | 50.30% | 857 |
| Submitting ACT Scores | 19% | 324 |
Why This Matters: Stanford is returning to test-mandatory for next cycle, but 69.3% of enrolled students in 2024 submitted scores. And as you’ll see, they’re nearly perfect.
A clear majority of applicants, over two-thirds, chose to include standardized test results, even when they weren’t required. And unsurprisingly, those scores skewed very high. You could argue that only top scorers opted in, but when that many students are submitting results, it’s a strong signal that the overall score profile of admitted students isn’t likely to shift dramatically once all applicants are submitting scores.
First-time, first-year students with scores in each range:
| Test | 25th Percentile | 50th Percentile | 75th Percentile |
|---|---|---|---|
| SAT Composite | 1510 | 1540 | 1570 |
| SAT Evidence-Based Reading + Writing | 740 | 760 | 780 |
| SAT Math | 770 | 790 | 800 |
| ACT Composite | 34 | 35 | 35 |
| ACT Math | 33 | 35 | 36 |
| ACT English | 35 | 35 | 36 |
| ACT Science | 33 | 35 | 36 |
| ACT Reading | 34 | 36 | 36 |
| Score Range | SAT Evidence-Based Reading + Writing | SAT Math |
|---|---|---|
| 700-800 | 95.80% | 97.20% |
| 600-699 | 4.10% | 2.50% |
| 500-599 | 0.10% | 0.40% |
| Score Range | SAT Composite |
|---|---|
| 1400-1600 | 97.30% |
| 1200-1399 | 2.50% |
| 1000-1199 | 0.20% |
| Score Range | ACT Composite | ACT English | ACT Math | ACT Reading | ACT Science |
|---|---|---|---|---|---|
| 30-36 | 99.10% | 98.10% | 95.40% | 98.50% | 96.30% |
| 24-29 | 0.60% | 1.90% | 4.00% | 1.20% | 3.40% |
| 18-23 | 0.30% | 0% | 0.60% | 0.30% | 0.30% |
Standardized Test Score Takeaways:
The average Stanford admit is getting 1550+ or 35+ on their standardized tests
The extremely small number of students getting the lower scores are the exception, not the rule.
The 75th Percentile for SAT Math and for all sections of the ACT is a perfect score – you need perfect grades to be competitive
When a school’s 25th percentile score already sits in the top 1% of all test takers nationwide, it’s a pretty clear signal that the applicant pool is stacked. For Stanford, that means truly competitive candidates are usually looking at something in the 1550+ range on the SAT or a 35+ on the ACT. Yes, that bar is exceptionally high – because Stanford is exceptionally selective.
We’re not sharing this to intimidate you or make the process feel hopeless. This is about being honest and realistic. And the same principle applies to your GPA. When you’re applying to a place like Stanford, you’re competing against thousands of students who are not just strong, but near-perfect on paper. Knowing this upfront helps you plan strategically rather than guess. The average high school GPA of all degree-seeking, first-time, first-year (freshman) students who submitted GPA was 3.94, and 68.1% of applicants submitted their GPA.
| GPA Range | Percentage |
|---|---|
| 4 | 73.30% |
| 3.75-3.99 | 16.50% |
| 3.5-3.74 | 6.70% |
| 3.25-3.49 | 3.00% |
| 3.0-3.24 | 0.30% |
| 2.5-2.99 | 0.30% |
Key GPA Takeaways:
The vast majority of applicants submitted their GPA
Less students had a 4.0 than we expected – but still over 70% did
The average GPA of 3.94 is still nearly perfect
| Class Rank | Percentage |
|---|---|
| Top tenth of HS graduating class | 97.80% |
| Top quarter of HS graduating class | 100% |
| Percent reporting class rank | 18.80% |
Key Class Rank Takeaways:
Only ~19% of students submitted class rank, but many schools do not track this data.
100% of applicants submitting GPA were in the top 25% at their school
Let’s clear this up upfront: that tiny slice of students with ACT scores in the mid-20s or GPAs in the low-to-mid 3s are always outliers. You should not look at those stats and think, “Great, that means I still have a shot.” That’s not how this works. In reality, we have no insight into who those students are or why they were admitted.
Yes, they could be recruited athletes or legacies – but they might also be first-gen students from under-resourced schools, students with extraordinary life circumstances, internationally displaced applicants, or people doing work at a truly exceptional level. The point is, those numbers don’t tell a story you can successfully reverse-engineer. At a place like Stanford, those cases are exceptions for reasons you’ll never see reflected in a data table.
TL;DR? For the best shot at admission, you need perfect grades and scores. That’s it.
Restricted Early Action
Stanford does not do the standard Early Decision application, instead opting for Restricted Early Action. These plans are non-binding, but limit you from applying ED to other schools. We don’t love REA.
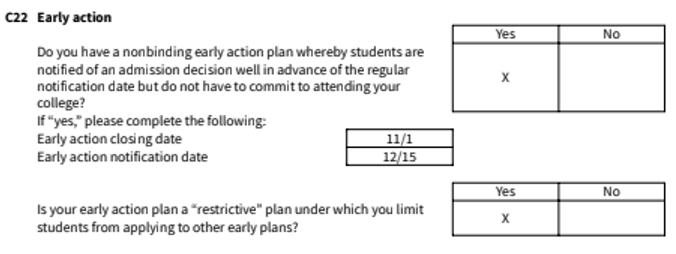
We also don’t love REA because they’re not asked to publish the sweet, juicy numbers that tell us what your odds are in those early rounds!
What we can tell you is that Stanford REA is competitive and nowhere near a sure bet. If you’re a really competitive applicant, it might be a smart move, but it also might not be if you should be EDing somewhere more in your wheelhouse.
Waitlist
Stanford thankfully publishes its waitlist data, which many schools avoid.
| Students placed on waitlist | 483 |
|---|---|
| Students accepting a spot on the waitlist | 414 |
| Students admitted off the waitlist | 25 |
| Waitlist acceptance rate | 6% |
Why This Matters: Getting waitlisted at Stanford doesn’t mean it’s the end of the line. You can get off the waitlist at Stanford, and we’ve helped countless students do it before.
A waitlist decision signals that Stanford sees you as admissible, but the class simply filled up before they could offer you a spot. Historically, Stanford doesn’t pull many students from the waitlist, which makes the odds feel intimidating. Still, it’s not zero – and the waitlist does have a higher acceptance rate than overall admissions – and every year, we work with students who successfully navigate that process and turn a waitlist into an acceptance.
Considerations
One of the trickiest sections of the CDS is the list of “Considerations” that a school says it weighs in its decisions. Some of these are straightforward and measurable, like GPA and test scores. Others are far less concrete, falling into the gray area of nonacademic qualities that are much harder to define, quantify, or reverse-engineer.
| Academic Factors | Very Important | Important | Considered | Not Considered |
|---|---|---|---|---|
| Rigor of secondary school record | X | |||
| Class rank | X | |||
| Academic GPA | X | |||
| Standardized test scores | X | |||
| Application Essay | X | |||
| Recommendation(s) | X |
Key Takeaways for Academic Factors:
Most everything is “Very Important” to Stanford, which comes as no surprise
Scores are only “Considered,” but that may have to do with the previous test-optional policy and not their policy going forward
Subjective things like your essay and recommendations will be extremely important to master and cultivate
| Nonacademic Factors | Very Important | Important | Considered | Not Considered |
|---|---|---|---|---|
| Interview | X | |||
| Extracurricular activities | X | |||
| Talent/ability | X | |||
| Character/personal qualities | X | |||
| First generation | X | |||
| Alumni/ae relation | X | |||
| Geographical residence | X | |||
| State residency | X | |||
| Religious affiliation/commitment | X | |||
| Volunteer work | X | |||
| Work experience | X | |||
| Level of applicant’s interest | X |
Key Takeaways for Nonacademic Factors:
Stanford does not track demonstrated interest
Being a CA resident will not help you with Stanford
These factors, beyond those “not considered,” should all be taken seriously.
As you’ll notice, the nonacademic criteria range from the concrete to the highly interpretive. Some, like geographic background, are easy to understand. Others, such as “character,” are much murkier. Those judgments are likely drawn from a combination of essays, recommendations, and overall application context, but there’s no clean formula here. And that’s exactly what makes these elements so hard to game or plan around in a precise way.
Now let’s talk about extracurriculars, which we think is one of the most important things for students to focus on. For truly competitive students, activities are often the differentiator. The strongest applicants aren’t just checking boxes with a few clubs, a leadership title, and a sport. They’re building deep, focused involvement that clearly connects to their academic interests and long-term goals. Stanford is looking for students who’ve pursued something with real curiosity, initiative, and follow-through. Helping students shape those kinds of distinctive, authentic profiles is something we do every single year, and it’s what makes the difference.
Conclusion
There’s no question that Stanford sits firmly in the ultra-selective category. That’s not news. What you have now, though, are clearer reference points and benchmarks to help you understand what it actually takes to be competitive in Stanford’s applicant pool.
At the same time, numbers alone don’t tell the whole story of what Stanford looks for, and they certainly don’t say anything definitive about you as an individual applicant. When we work with students, whether they’re legacies, applying early, being recruited, or coming through the process without any hooks, the academic guidance stays grounded in the same reality, but the strategy never looks identical. Our approach is built around your specific interests, strengths, and goals. There’s no single blueprint for getting into Stanford, but there are smart, intentional steps that can meaningfully improve your odds.
One way to increase your odds? Working with college consultants who are experts at getting students into Stanford. We help countless students gain admission to top universities every single year – reach out to us today to get started.