For the 2024-2025 admission cycle, Harvard University had a 3.64% acceptance rate. However, that’s just one number, and all we can really glean from this number is that getting into Harvard is, contrary to Elle Woods’ statement, very hard. At elite colleges, we have to dig deeper into their statistics to learn trends, analyze changes, and uncover the truth behind what’s really going on in elite admissions. Thankfully, we do this every single year to help optimize the process for our clients.
Every year, hundreds of institutions of higher learning publish something called the Common Data Set (also known as the CDS). The Common Data Set Initiative serves as a standardized set of statistics and information to help publishers like US News & World Report, College Board, and Peterson’s provide the most accurate numbers possible when ranking and reviewing colleges. There are 10 sections of the CDS, but today we’re going to break down just one section of Harvard’s 2024-2025 CDS, Section C: First-Time, First-Year Admission.
C1: First-Time, First-Year Admission, Applications
The very first subsection of section C gives us the hot, juicy data you all want to see, the pure admissions numbers. In 2025, 54,008 students applied to Harvard, and 1,970 were admitted. But Harvard doesn’t just leave it at that – they also give us the breakdown by gender (more women are admitted than men, but not by a lot), in-state, out-of-state, and international student status.
| First-Time, First-Year Applicants | Total | Admitted | Acceptance % | Enrolled | Yield % |
|---|---|---|---|---|---|
| Men | 25,613 | 920 | 3.6% | 767 | 83.4% |
| Women | 28,372 | 1050 | 3.7% | 880 | 83.8% |
| Another Gender | 23 | 0 | 0% | n/a | n/a |
| First-Time, First-Year Applicants | Total | In-State | Out-of-State | International |
|---|---|---|---|---|
| Applied | 54,008 | 3,032 | 34,216 | 16,760 |
| Admitted | 1,970 | 265 | 1,380 | 325 |
| Enrolled | 1,674 | 277 | 1,125 | 295 |
| Acceptance % | 3.6% | 8.7% | 4.0% | 1.9% |
| Yield % | 83.6% | 0 | 0 | 0 |
It’s interesting that despite being a private institution, in-state students have an acceptance rate of 8%, and out-of-state students are almost half, at 4%. This can probably be attributed to multiple factors, like employee parents, legacy students, and, not to mention, the plethora of elite college prep and boarding schools in Massachusetts.
One of the most shocking numbers from this is international students: they make up about 16% of the total admits to Harvard, but their own acceptance rate is 1.9%
To compare to 2024’s data – Harvard had approximately 2,000 fewer applicants in 2024, and admitted five more students than last year. What does this mean? Great question. A lot of colleges went test-optional in the wake of COVID, and a lot of Ivies and elite colleges are bringing back required test scores. While many schools saw a huge surge in applications once the barrier of test scores was removed, quite a few are realizing that this may have been a mistake for the academic success of their classes.
Dartmouth released a really interesting and very transparent statement on why they brought back test scores, and the logic here makes sense to us. We’re also confident this logic is shared by the other Ivies who brought back test scores, like Harvard. Essentially, they believe test scores were a huge predictor of freshman year academic success. Even if you didn’t have a high score in the general applicant pool, but had a high score relative to your high school, you had a higher rate of freshman year success than a kid from a college prep school who applied test-optional.
C9-C2: First-Time, First-Year Profile, or Scores and Grades
This next section applies to first-time, first-year students who enrolled in 2024, which is extra interesting because it’s the last year Harvard was test-optional.
| Percent | Number | |
|---|---|---|
| Submitting SAT Scores | 54% | 892 |
| Submitting ACT Scores | 19% | 321 |
The vast majority of applicants who enrolled in Harvard in 2024 did submit some kind of test score, and based on the admissions stats from the 2023-2024 CDS, we can deduce that only 432 of the 1,645 enrolled students did not submit a score. While this is no longer as relevant for Harvard, since it isn’t test-optional, it does still apply to the majority of other elite schools that are still test-optional.
Before we get into the specific score breakdowns, let’s talk a little bit about how we guide our students when it comes to submitting scores. To be truly competitive for Harvard, you need a 1550+ or a 35+, period. You may see stats below that make you think, “Oh, maybe my 25 can still work!” It will not. And while a 25 might work for one or two applicants to Harvard every year, that probably does not include you. You have no idea what your competition looks like, even a kid at your own school may have tricks and cards up their sleeve that you could never predict. The students with lower scores and grades could be recruited athletes, legacy students, Title 2 HS graduates, refugees, etc., you truly have no clue. And since you have no clue, you must give yourself the best strategic advantage possible: getting as close to a perfect score as humanly possible.
| Test | 25th Percentile | 50th Percentile | 75th Percentile |
|---|---|---|---|
| SAT Reading | 740 | 760 | 780 |
| SAT Math | 770 | 790 | 800 |
| ACT Composite | 34 | 35 | 36 |
| ACT Math | 32 | 35 | 36 |
| ACT English | 35 | 35 | 36 |
| ACT Science | 33 | 35 | 36 |
| ACT Reading | 34 | 36 | 36 |
First Time, First-Year Students with scores in each range:
| Score Range | SAT Reading and Writing | SAT Math |
|---|---|---|
| 700-800 | 95% | 98% |
| 600-699 | 5% | 2% |
| 500-599 | 0% | 0% |
| Score Range | ACT Composite | ACT English | ACT Math | ACT Reading | ACT Science |
|---|---|---|---|---|---|
| 30-36 | 98% | 97% | 90% | 98% | 93% |
| 24-29 | 2% | 3% | 9% | 2% | 6% |
| 18-23 | 0% | 0% | 0% | 0% | 0% |
The exact same logic goes for GPA and class rank statistics. You can see that because you don’t have to submit class rank, only 29% of students do. And of course, all 29% of those students are at least in the top half of their graduating class. But as you look into the GPA breakdowns, please do not think “Oh! My 3.8 is totally enough, they let in someone who at least had less than a 2.5!” Statistically, this thought process will not work out in your favor. 72% of enrolled students had a 4.0. You want to be as close to that 4.0 as possible, because your chances drop off dramatically in the 3.75-3.99 range.
| GPA Range | Percent (all enrolled student) |
|---|---|
| 4.0+ | 72.41% |
| 3.75-3.99 | 22.20% |
| 3.5-3.74 | 4.11% |
| 3.25-3.49 | 0.60% |
| 3.0-3.24 | 0.17% |
| 2.5-2.99 | 0.34% |
| 2.0-2.49 | 0.17% |
We know it might sound harsh, but we believe in giving our clients honest feedback and clear answers. We want to help you find the right school for you, in every sense. You want to go to college somewhere that has the programs you want and also is the right academic fit for you. We can help you do that. So, if you don’t have a 4.0, if your grades aren’t actually perfect, your chances really do drop dramatically.
Withheld Statistics
Something worth noting is that Harvard does not release all the statistics the CDS requests. Unfortunately, they are things we wished they released, like waitlist data and Early Action acceptance information.
TL;DR: absolutely no information!
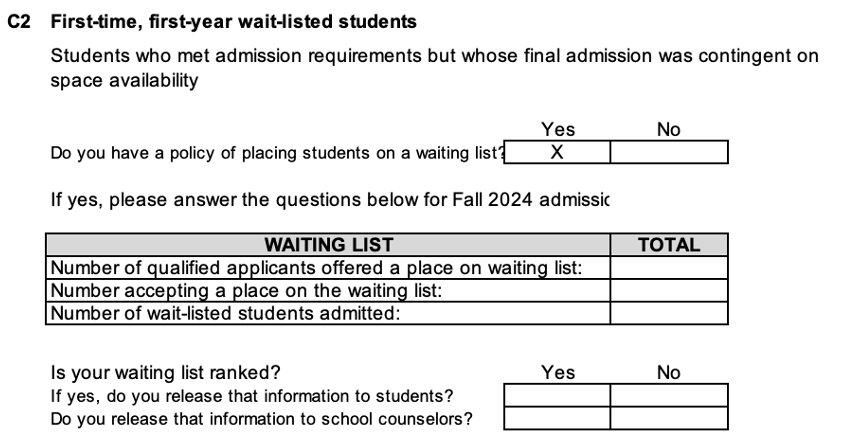
We help students get off the Harvard waitlist every year, so we know it is possible, but the lack of transparency in the data is still infuriating.
The CDS didn’t ask Harvard to put the specific numbers for their Restricted Early Action plan, but we still think that if they had the option, they wouldn’t list them. However, again, we help students get into Harvard REA every single year, so we know it’s possible.
So why does Harvard not release this data? First, we can tell you that a lot of schools don’t, which is frustrating when you lean on data to inform decisions and strategy, as we do. It’s probably a mix of a few things, including but not limited to Harvard’s ego, their desire to be seen as ultra-exclusive, not wanting geniuses like us to hack their process, and to cut down on waitlisted students bugging them incessantly.
Considerations: harvard admissions considerations
Another part of the CDS that’s valuable to look at is C7, or the factors that go into admissions decisions. One of the super annoying things Harvard does here is simply list everything as “Considered” instead of “Important” or “Very Important.” Their nonchalance is extremely irritating and it also gives the wrong impression to students.
| "Considered" | "Not Considered" |
|---|---|
| Rigor of Secondary School | Class Rank |
| Academic GPA | State Residency |
| Standardized Test Scores | Religious Affiliations/Commitment |
| Application Essay | Level of Applicant's Interest |
| Recommendations | |
| Interview | |
| Extracurricular Activities | |
| Talent/Ability | |
| Character/Personal Qualities | |
| First Generation | |
| Alumni/ae Relation | |
| Geographical Residence | |
| Volunteer Work | |
| Work Experience |
We are here to tell you all that your GPA, scores, extracurriculars, etc., are all extremely important to Harvard. You already saw that test scores are mandatory, and the GPA spread leans heavily to the 4.0 in the sections above, so why wouldn’t these things be absolutely crucial to Harvard? The answer is, they are crucial, but Harvard’s trying to seem “chill” or something, and we hate it. Harvard is not chill. They are actually the definition of “not chill.” They are, like us, type-a nut jobs.
The other thing lost in this data is nuance. “Extracurriculars” is a minefield in and of itself. We work with successful Harvard applicants every year, and we can tell you that joining debate, playing soccer, being class president, and doing some volunteer work every now and then is absolutely not enough. The students we get into Harvard conduct and publish research, invent medical devices, start successful businesses, and generally do some of the most impressive things we’ve ever seen. If you have Harvard in your sights, you need to get engaged at a high level, outside of school. And we can help you do that.
Conclusion
So what does all this mean at the end of the day? Harvard is hard-vard (lmao get it???) to get into. We already knew that – but now you have some proper guidelines and benchmarks to give yourself the best shot at success possible.
However, the data doesn’t tell us everything about what Harvard values, and it also tells us nothing about you. When we work with applicants, no matter what ‘type’ of applicant (legacy, REA, athlete, etc.), our academic and statistical advice is the same (Be Best), but our strategic advice is highly tailored to your individual interests and strengths. No two students are the same, and there’s no one, true, set path to Harvard.
One way to increase your odds? Working with college consultants who are experts in the field and have a high rate of success getting students into Harvard. We help countless students gain admission to top universities every single year – reach out to us today to get started.