Princeton has a 4.62% acceptance rate during the 2024-2025 admissions cycle, which means it is hard to get into. But makes sense for a school that boasts famous alumni like Michelle Obama, Jeff Bezos, and the fictional Jack Donaghy. But that 4.62% number really doesn’t tell us that much other than the school is hard to get into – and we already knew that before we wrote this post, and you already knew it before you read this post. There are a lot of other data points that can give us interesting insight into how schools operate, and today we’re going to break down Princeton’s data and tell you how to apply it strategically.
Sometimes schools don’t release their data in press releases or school newspaper articles, but those stats are tucked away in something called the Common Data Set (CDS). The Common Data Set Initiative was created for use by colleges, organizations, and private companies to rank, categorize, and analyze college statistics. All the statistics. This blog post is going to focus on just one of the 10 sections of Princeton’s 2024-2025 report, Section C: First-Time, First-Year Admission.
C1: First-Time, First-Year Admission, Applications
These are the main numbers everyone cares about: the raw admissions data. How many applied, how many accepted, and how many enrolled? For the 2024-2025 cycle, 40,468 students applied, 1,868 were accepted, and 1,410 eventually enrolled. That’s an acceptance rate of 4.62% and a yield rate of 75.5%.
Princeton Acceptance Numbers
| First-Time, First-Year Applicants | Total | Admitted | Acceptance % | Enrolled | Yield % |
|---|---|---|---|---|---|
| Men | 20,563 | 903 | 4.39% | 693 | 76.7% |
| Women | 19,883 | 965 | 4.85% | 717 | 74.3% |
| Another Gender | 22 | 0 | 0% | n/a | n/a |
| Applicants | # Accepted | Acceptance % | # Enrolled | Yield % |
|---|---|---|---|---|
| 40,468 | 1,868 | 4.62% | 1,410 | 75.5% |
| First-Time, First-Year Applicants | Total | In-State | Out-of-State | International | Unknown |
|---|---|---|---|---|---|
| Applied | 40,468 | 4,554 | 26,018 | 9,891 | 5 |
| Admitted | 1,868 | 234 | 1,425 | 209 | 0 |
| Enrolled | 1,410 | 192 | 1,056 | 162 | 0 |
| Acceptance % | 4.62% | 5.13% | 5.47% | 2.11% | n/a |
| Yield % | 75.5% | 82.1% | 74.1% | 77.5% | n/a |
The biggest takeaway you can get from this data set, aside from Princeton has an incredibly low acceptance rate and it is astonishingly hard to get into, is that the only people who might have any kind of “advantage” in the process are non-international students. This is common at a lot of Ivies and Ivy+ schools – priority is given to students in the US, and large amounts of international students are applying for a limited number of spots.
Another notable finding is that these numbers are not substantially different from those of the previous year. In 2023-2024, they had approximately 1,000 fewer applicants and a slightly lower acceptance rate of 4.5%. Princeton is one of the few Ivies that remains test-optional, and this is not the data we’d expect to see in that scenario.
C2: First-Time, First-Year Wait-Listed Students
Princeton, unlike many of their peers, does actually publish their waitlist data. Last cycle, 40 students were accepted off the waitlist out of the 1,396 students who accepted their waitlist spot. That’s a low waitlist acceptance rate (2.86%), even for Ivy League schools, but that also means it’s not impossible. We’ve gotten kids off the Princeton waitlist. As we often say to parents, getting off a waitlist is hard, but getting off a waitlist without writing a letter of continued interest is nearly impossible.
| Princeton Waitlist Statistics | Total |
|---|---|
| # of applicants offered a waitlist spot | 1,734 |
| # of applicants accepting waitlist spot | 1,396 |
| # of applicants admitted from waitlist | 40 |
When schools release waitlist data, it allows applicants who are holding out hope to be a little more realistic and pragmatic with their choice. If you’re on the Princeton waitlist, you should still accept a spot at another university, but that doesn’t mean you should give up. We help students get off the Princeton waitlist every single year, so we know it can be done.
C9-C12: First-Time, First-Year Profile, or Scores and Grades: Princeton test score data
| Percent | Number | |
|---|---|---|
| Submitting SAT Scores | 56% | 783 |
| Submitting ACT Scores | 21% | 303 |
Since Princeton is test-optional, we think it is worth saying that it’s important to take this data really seriously. If you’re applying to Princeton, you should be applying with test scores. 77% of their incoming class did last year, and you are more likely to be the rule than the exception.
| Assessment | 25th Percentile | 50th Percentile | 75th Percentile |
|---|---|---|---|
| SAT Composite | 1500 | 1530 | 1560 |
| SAT reading + writing | 740 | 760 | 780 |
| SAT Math | 770 | 790 | 800 |
| ACT Composite | 34 | 35 | 35 |
| ACT Math | 32 | 35 | 36 |
| ACT English | 35 | 35 | 36 |
| ACT Science | 33 | 34 | 36 |
| ACT Reading | 34 | 36 | 36 |
Our advice to clients, and as you can see from the above score ranges, is that you need a 1550+ or 35+ to be anywhere near competitive for Princeton, in addition to perfect grades. In the sections below, you will see some lower scores and grades – those do not apply to you. We don’t say this to be mean; we say this to give you the best preparation possible.
princeton sat/act test score ranges
| Score Range | SAT Reading and Writing | SAT Math |
|---|---|---|
| 700-800 | 94% | 96% |
| 600-699 | 6% | 4% |
| Score range | SAT composite |
|---|---|
| 1400 - 1600 | 97% |
| 1200 - 1399 | 3% |
| Score range | ACT composite |
|---|---|
| 30-36 | 96.37% |
| 24-29 | 2.97% |
| 18-23 | 0.66% |
It’s easy to compare yourself to others during the application process, and we’re sure that seeing scores in the 1200s or 20s or GPAs under 3.0 might make you think you’d have a shot no matter what. This just simply is not the case – you have no idea who else is applying to Princeton or why someone with a 21 ACT might be admitted over a perfect score. They could be athletes or legacies, but they could also be kids from low-income neighborhoods, refugees, people who dropped out of college and got their GED, etc. You really have no idea.
Princeton GPA Ranges (Enrolled Students)
| GPA Range | % Submit with Scores | % Submit without Scores | % Total |
|---|---|---|---|
| 4.0+ | 72.9% | 53.6% | 68.5% |
| 3.75-3.99 | 23.3% | 33% | 25.5% |
| 3.5-3.74 | 2.7% | 10.3% | 4.4% |
| 3.0-3.24 | .3% | 0% | .2% |
| 2.5-2.99 | .1% | .3% | .2% |
| Average HS GPA of All Applicants | % Who Submitted HS GPA |
|---|---|
| 3.95 | 99.3% |
Withheld Statistics
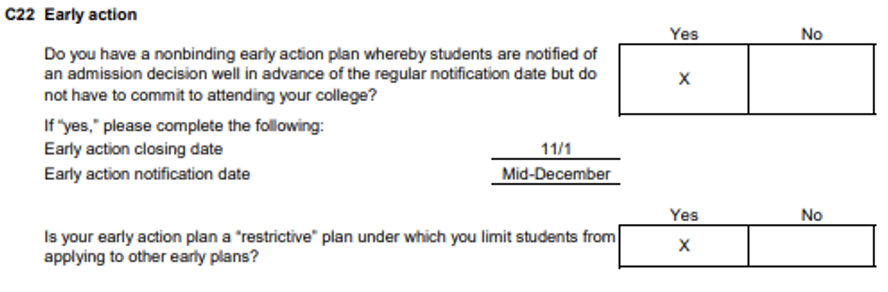
One piece of info Princeton keeps close to the chest is the stats on Restricted Early Action. They are technically not required to share that info with how the CDS is currently formatted, but we still find it a little bit annoying.
Princeton Admissions Considerations
The next part of the CDS, section C7, breaks away from numbers into the subjective. There are tons of factors that cannot be quantified that schools rely on to determine admissions. Yes, your grades and scores are key, but things like your essays, your recommendation letters, and even where you live can factor into your decision.
| Academic Factors | Very Important | Important | Considered | Not Considered |
|---|---|---|---|---|
| Rigor of classes | X | |||
| Class rank | X | |||
| GPA | X | |||
| Test scores | X | |||
| Essay | X | |||
| Recommendation | X |
| Nonacademic Factors | Very Important | Important | Considered | Not Considered |
|---|---|---|---|---|
| Interview | X | |||
| Extracurriculars | X | |||
| Talent/ability | X | |||
| Character | X | |||
| First-gen | X | |||
| Legacy status | X | |||
| Geographical residence | X | |||
| State residency | X | |||
| Religious affiliation | X | |||
| Volunteer work | X | |||
| Work experience | X | |||
| Level of interest | X |
We will also say that these categories, while better than nothing, don’t give you a very good picture of what they mean. The nuance is lost when everything you do out of school is flattened into “extracurriculars” or nebulous things like “character.”
At an Ivy like Princeton, extracurriculars cannot be just clubs, sports, and maybe a student council position. Your extracurriculars need to show depth, intellectual curiosity, and engage with the topics that relate to your major. The students we work with are doing everything from inventing medical devices to publishing humanities research in highly respected publications. That’s the level you need to get to – and if you’re not there yet, or don’t know how to get there, we can help you with that.
Conclusion
What can we glean from everything we’ve seen? Well, Princeton is hard to get into, across the board. We know that you need to have as close to perfect grades and scores as possible. And we know that some of those non-academic factors are really important to them. That means we can carve out a strategy.
What the data doesn’t tell us is how you fit into their school. Every student is unique, and if you’re wondering if Princeton is the right fit for you, we can help you figure that out. We don’t just match students with what looks or sounds the best, we focus on finding the right personality and culture fit and build a profile that helps you stand out from the rest of the crowd.
One way to increase your odds? Working with college consultants who are experts in the field and have a high rate of success getting students into Princeton. We help countless students gain admission to top universities