2018 acceptances for the Class of 2022 are out and what we predicted has come to pass: it is harder to get into college than ever. HOT TAKE. Acceptance rates are plummeting, and the rates at top schools have yet again hit record lows. At the same time, the number of applicants who were waitlisted is off of the charts. Colleges are becoming more conservative in their admissions decisions. Unfortunately, students are bearing the brunt of it.
A large part of helping kids get into great colleges is knowing where college admissions is headed. It’s like watching the market. We know what has happened in the past, and we use that to predict what will happen in the future. Those predictions help us guide students towards schools that are not only great fits but also accessible to them. A student who got into Barnard in 2015, when the acceptance rate was nearly 25%, could possibly be rejected today. Over the past four years, the acceptance rate for Barnard has dropped to less than 14%. We make our bets off of numbers, and these numbers are staggering.
As we’ve said, this drop in acceptance rates is for a variety of reasons. With few exceptions, colleges are receiving more applications. There are more people applying, but each person is also applying to more places. Much of this is because of the broad adoption of the Common App. Students are able to apply to long lists of schools fairly easily. Whereas it used to be standard to apply to 6-10 schools, lists today often run from 15-20. We don’t like this trend, and we don't advise applying to 20 schools, but it is a trend nonetheless. More applications for the same number of spots means lower acceptance rates.
On top of this, colleges have become obsessive about their ‘yield’ or ‘enrollment’ rates. The enrollment rate is the number of accepted students who actually end up attending. It’s one of the few numbers an admissions office can control, so they’ve spent a lot of time dialing down on how to get it up. Early Decision is the first step. Students admitted early are, in the vast majority of cases, completely committed. That’s a 100% enrollment rate. That's why you see some schools (like UPenn) fill upwards of 50% of their class with Early Decision. Regular Decision is where things get dicey. With students applying to so many schools, they may have a long list of choices come March — so how can a college make sure that they are an admitted students top pick?
This is where selective admissions and the waitlist come into play. By selective admissions, we don’t mean that they are picking the best and the brightest of their applicant pool. Nope. They’re picking the best and the brightest of their applicant pool that they think will attend. This is key. If you’re qualified for Harvard but applied to Tulane as a “safety,” Tulane may reject you just because they know you aren’t going to attend, which would hurt their enrollment percentage.
For applicants that appear to be on the fence, the waitlist is a final filter. If you’re waitlisted, and you write a letter stating that you will absolutely attend if you get in, you’re a safe bet. If you don’t reaffirm your interest, why should they go out on a limb for you?
It’s not surprising, then, that the number of students waitlisted by top schools this year is also astonishing. If you’re on a waitlist, don’t hold your breath. Yale’s waitlist is 1,102 deep. According to their Admissions Office, they don’t know if even a single one of those 1,102 will make it in.
Cornell admitted 5,288 students, but let 6,684 onto their waitlist. Even if every single one of the admitted students declined to go to Cornell, 1,396 students would still be on the waitlist.
Ok, you get it now, things are getting harder, but most of the drops in admissions rates were only between .5 and 3 percent. That’s a tiny difference in the scope of things, right? Wrong. The 1% drop at Brown (from 8.3% to 7.2%) may seem small, but each percentage point is a child. Or many children. If you’re in the 50th percentile for their admissions profile or below, that kid could be you.
If you’re a parent of a high school freshman, sophomore, or junior, or a student yourself, you need to get realistic. Being in the 50th percentile for Yale today doesn’t make it a target school for you now, let alone in the future. It’s a reach, and it’s only becoming more of a reach.
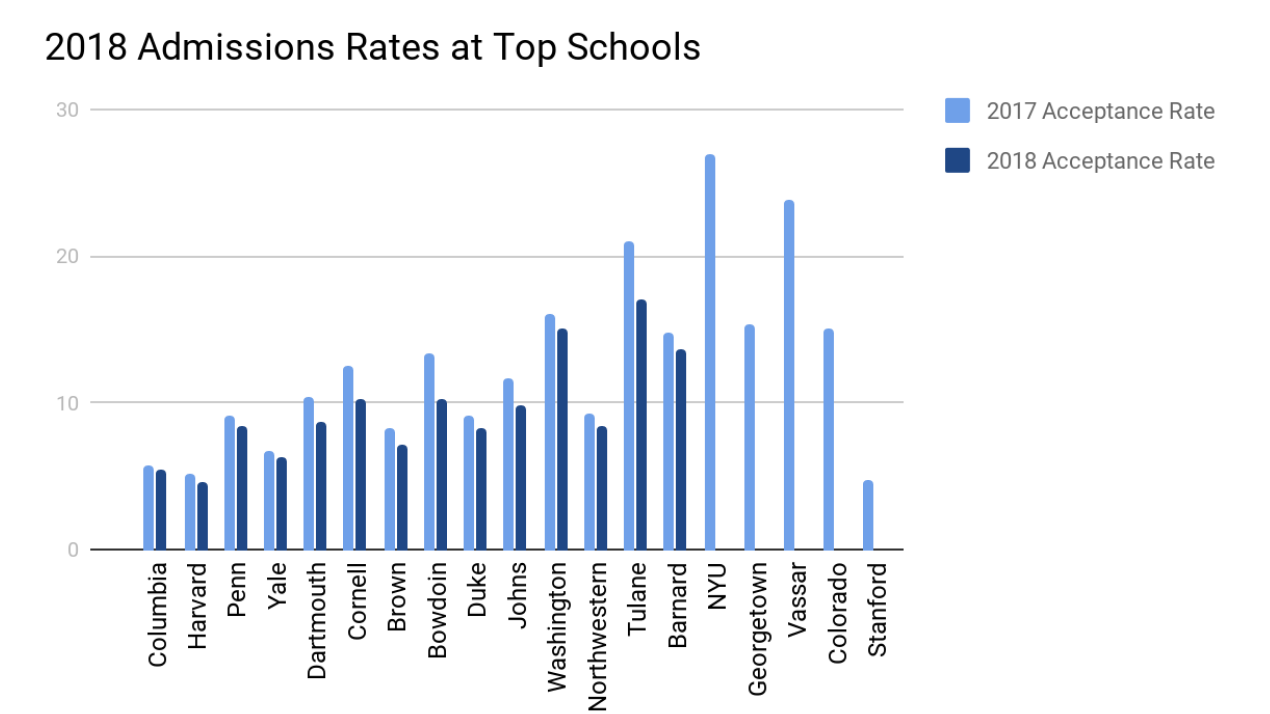
Below are the 2017 and 2018 acceptance rates for some top schools. We put them in a graph, as well as in a chart, to illustrate what we are talking about. Numbers, after all, don’t lie and these are pretty clear. It’s harder to get into college than ever and it’s only going to get harder from here, so students who will be applying to college in the coming years need to be strategic. It isn’t just about where you want to go; it’s about playing the market and honestly asking yourself: “where can I get in?”
At The Koppelman Group, every one of our 2018 kids got into one of their top three schools. This doesn’t always mean it’s one of the top three schools in the country, but a top three school for them. Our admissions results are an anomaly. They defy the trends. How do we pull it off? We watch the data, we manage expectations, and we formulate lists that are predictive of what is possible. College admissions is a game, and we’re playing it.
The Numbers
*There are a lot of admissions statistics thrown around by different college websites. The ones listed here are those provided by the schools themselves, as we consider them to be the most accurate. Many schools have not released the 2018 numbers yet. While estimates are available, we have not included them as they are often incorrect.